In the course of our “cloud native” journey, we have been looking more into the topic of SLAs, SLOs and SLIs lately (yes, follow that link when you’re done here, it’s from Google’s SRE team).
I thought I’d share some of the perhaps more trivial insights we had when trying to come up with suitable Service Level Indicators, and how we calculate those using Cloud Native technology, in our case with the open source monitoring system Prometheus. The information I am gathering here is readily available from many places, but I haven’t found it in one place as a “recipe”, and that’s where this blog post comes from. In other words and as a disclaimer: None of this is something I invented, I’m just summing it up here :-)
Why would you…?
When going cloud native and “devops”, you sooner or later encounter the need to explicitly calculate how well you’re doing your job; you can’t hand it off to some “operations team” anymore, it’s really within your responsibility to come up with hard facts of how well your application is working.
With “hard facts”, I mean real numbers. And those numbers should make sense to anybody looking at them, without much interpretation. Plus they should reflect to as large an extent as possible how happy your customers are when using your application.
Usually this means checking for at least the following things:
- Is the application working? I.e., is the main functionality available?
- Are the non-functional aspects within limits? Short: Is your application fast enough?
Mapping to numbers
A common way to map these aspects to real numbers is to use the following approach: For a specific use case, find a way to measure how long this takes. There are multiple ways of doing this, either by instrumenting your own code, or by measuring via black box testing from the outside.
After you have found a way to get the measurements, define a duration (in seconds/milliseconds) which is what the customer would perceive as good performance, and calculate a percentage on that, so that you receive a indicator like this: “Percentage of requests/pages served within 200ms” (example for a typical white box metric based value), or in a similar way, “Percentage of monitoring runs which finish within 10000ms” (which can be a typical black box based value). These can be Service Level Indicators (SLI).
Such SLIs can then be held against a Service Level Objective (SLO), which says e.g. “We want to serve 95% of requests within 200ms.” This type of sentence can also be used as a Service Level Agreement towards your customer; an SLA is mostly less strict than an SLO, so that you can still meet your SLA, even if you did not meet your SLO.
How do we get the data then?
Here I am assuming we are using Prometheus as a monitoring tool, which means that Prometheus usually tries to scrape end points you tell Prometheus to scrape with a certain interval, let’s say every 15 or 30 seconds. Prometheus then stores the scraped metrics in its time series database.
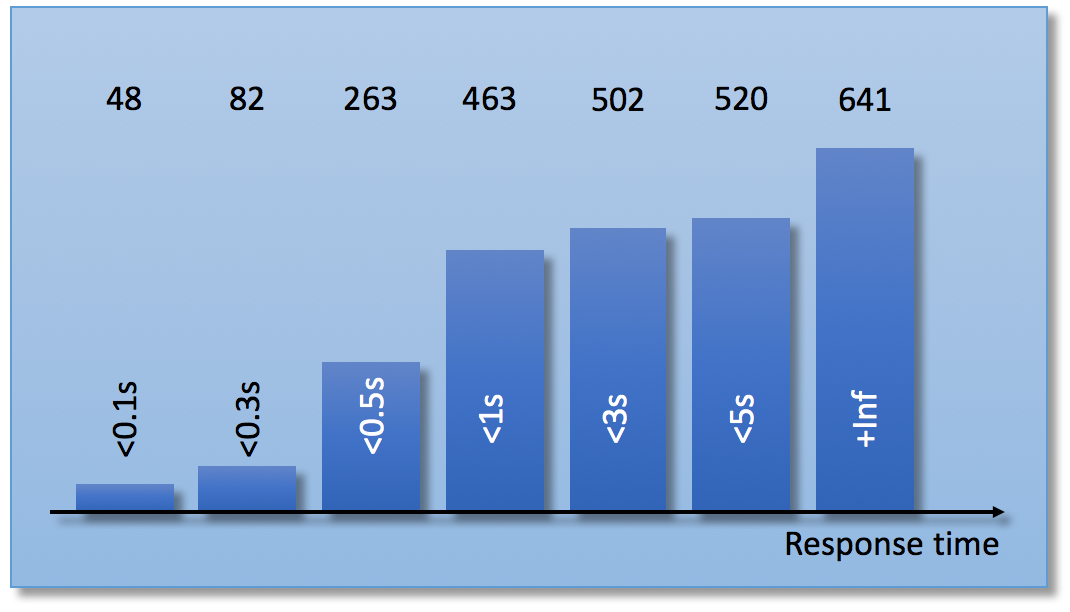
To enable the kind of queries as above, you usually instrument your services with “histogram” type metrics, which counts response times and puts them into “buckets”. You don’t have to store all separate measurements, but instead you just keep track of how many measurements fall into which bucket, and the total count. Prometheus encourages you to use the following type of buckets:

This means each bucket is always a “less than n ms” type of bucket, meaning that buckets “to the right” contain all buckets “to the left”.
Which bucket sizes are meaningful is up to you; depending on your defined SLIs, you should have one bucket which corresponds to the upper bound of your indicator, so that it’s possible to reason about it (we’ll get to that below).
Creating this kind of metric is quite simple if you use one of the many Prometheus client libraries; most have direct support for histogram type metrics out of the box. You usually just have to add the bucket sizes and instrument your code (and of course expose a /metrics endpoint).
Querying Prometheus for the SLIs
Given that Prometheus now scrapes your histogram metrics, there will now be metrics inside Prometheus which look approximately like this, at a specific point in time:
my_response_time_buckets{le="0.1", instance="service-a-0"} 23
my_response_time_buckets{le="0.1", instance="service-a-1"} 25
my_response_time_buckets{le="0.3", instance="service-a-0"} 48
my_response_time_buckets{le="0.3", instance="service-a-1"} 34
my_response_time_buckets{le="0.5", instance="service-a-0"} 127
my_response_time_buckets{le="0.5", instance="service-a-1"} 136
...
my_response_time_buckets{le="5", instance="service-a-0"} 247
my_response_time_buckets{le="5", instance="service-a-1"} 273
...
my_response_time_count{instance="service-a-0"} 302
my_response_time_count{instance="service-a-1"} 339
The metric Prometheus scraped was called my_response_time, and it has corresponding “buckets” and a “count” metric; you can also see here that the service which was scraped has two instances running, service-a-0 and service-a-1 (these are just example values, it will look different for you). There is a separate metric value for each “bucket”, which is distinguished via the le="..." label.
Now running the following query in Prometheus will get you a first version of our SLI, let’s say “percentage of requests served within 500ms”:
my_response_time_buckets{le="0.5"} / ignoring (le) (my_response_time_count) * 100
This will return a vector of values, like this:
| Element | Value |
|---|---|
{instance="service-a-0"} |
42.05 |
{instance="service-a-1"} |
40.12 |
Which means: Since the start of the service, 42.05% of the requests on instance service-a-0 were answered in under 500ms, and for the instance service-a-1 the corresponding value is 40.15%
The ignoring(le) enables Prometheus to match the vectors via their labels; this is necessary as the my_response_time_count metric does not have a le label. So, this is nice, but not quite what we’d want to have.
Refining the queries
The above query has the following issues:
- What happens if a service is restarted, and thus losing the metrics?
- How do I get a view over all service instances?
- For which time range do I want to calculate the SLI?
Fortunately, the answer to most of the above questions is the quite remarkable Prometheus function rate(). The rate() function takes a time range and a counter as parameters and calculates a “per second rate” of the counter increasing, doing very elaborate extrapolating and taking into account that counters (here: buckets) may have been reset due to restarting services and so on.
The second thing we need is the the aggregation operator sum(), which does just that, sums up metrics over different labels, in our case over different instance labels.
So, let’s calculate the following:
Which percentage of requests in the last 30 minutes was served in 500ms or below?
This can be expressed in the Prometheus Query Language like this:
sum(rate(my_response_time_buckets{le="0.5"}[30m])) / sum(rate(my_response_time_count[30m])) * 100
The rate() function takes a time series as a parameter, which is created by the expression my_response_time_buckets{le="0.5"}[30m] as per Prometheus Query Language notation. Doing the same with the _count counter and some mathematical happiness (dividing the rate with the other rate actually renders something useful again), the expected result of such a query would something like this:
| Element | Value |
|---|---|
{} |
53.79 |
The value here shows e.g. that the SLI for the last 30 minutes is slightly better than for the entire runtime of the services. Perhaps due to caching effects, or other startup latencies.
Aggregating custom time ranges
Displaying the above value in a dashboard for immediate view is a good idea. But this is just a snapshot of the current SLI, for the previous n minutes.
In order to aggregate over a custom time range, like “yesterday from 08 to 18” (e.g. because that’s the availability hours we promise our customers in our SLA), we can make use of the Prometheus http API. The API allows to run a query for a specific time, using the &time=<epochs> query parameter. In combination with a ten hour time series, we can now ask for the aggregated SLI for the entire day, using a single API call:
$ curl "http://prometheus:9090/api/v1/query?query=sum(rate(my_response_time_buckets%7Ble%3D%220.5%22%7D%5B10h%5D))%20%2F%20sum(rate(my_response_time_count%5B10h%5D))%20*%20100&time=1509040800"
Rendering the following JSON result:
{"status":"success","data":{"resultType":"vector","result":[{"metric":{},"value":[1509040800,"44.2787823812"]}]}}
The /api/v1/query endpoint accepts a time parameter (epochs, seconds since 1/1/1970), and an URL encoded Prometheus query string as a query parameter, in this case
sum(rate(my_response_time_buckets{le="0.5"}[10h])) / sum(rate(my_response_time_count[10h])) * 100
Adding a scalar function to the expression makes the resulting JSON even easier to parse:
scalar(sum(rate(my_response_time_buckets{le="0.5"}[10h])) / sum(rate(my_response_time_count[10h]))) * 100
And the resulting JSON will look like this:
{"status":"success","data":{"resultType":"scalar","result":[1509040800,"44.2787823812"]}}
Using Black Box histogram from “the outside”
The above approach makes most sense if you can get your metrics from inside your application via white box measuring, but it can also work with measurements from “the outside”, e.g. from checking end-to-end functionality.
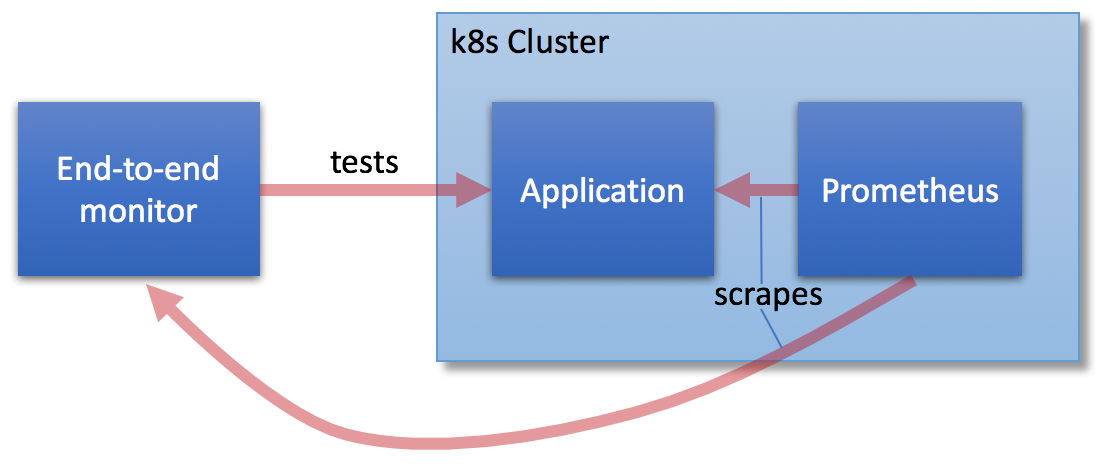
In the simplest case, Prometheus can reach the end to end monitoring application, which collects metrics just as with the white box instrumentation. This makes it possible to calculate SLIs based on things like “Percentage of log ins which reach time to first use within 3000ms”. The setup for that could look like this:

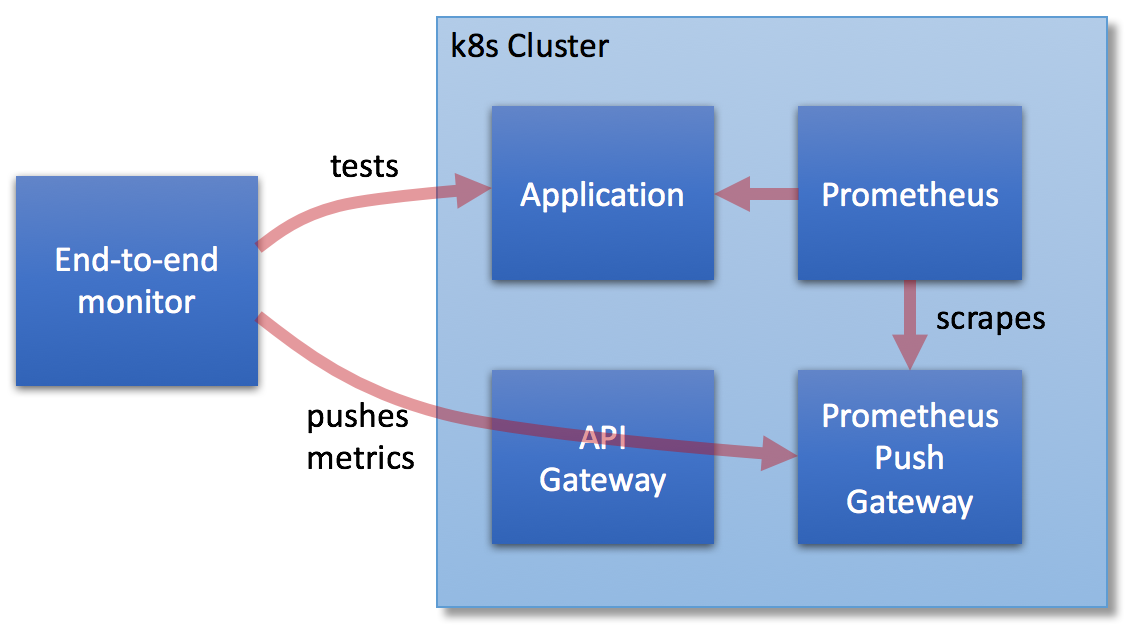
This obviously requires Prometheus to be able to reach the monitoring application, and it needs to have a reachable metrics end point. In some cases, this is difficult to achieve. This leads us to a second possibility to get such metrics into the same Prometheus instance as for the white box tests:

In this case, we have added two components: An API gateway, and the Prometheus Pushgateway. The API Gateway (e.g. Mashape Kong, or, shameless plug: using wicked.haufe.io) makes sure only authenticated clients may reach the Pushgateway, and the Pushgateway accepts metrics being pushed to it, which it in turn then exposes via its own /metrics end point to a Prometheus instance inside e.g. a Kubernetes Cluster.
FWIW, the second pattern is what we have applied for our production setup; both approaches also allows us to implement alerting on top of the “black box” type metrics.
Wrap up
I hope you could get some insight on how SLIs can be calculated using histogram metrics and Prometheus - fairly easily and straightforward, if you start from the right direction. Starting with Prometheus can be challenging, but it’s - in my opinion - absolutely worth the effort; this applies the more if you are on Kubernetes, but even in a non-containerized environment, Prometheus can make very much sense.
Obviously there are more things you could write about here, like how black box end to end tests can be written. We have very good experience with Puppeteer, but that will be the topic of a future blog post
If you have any questions, just feel like commenting, please go ahead and do so. Are there any topics regarding these things you would like to hear more about, then also just drop a comment, and I’ll see what we can do. Thanks for reading this far!