With an increasing number of systems decoupled and scattered throughout the landscape it becomes increasingly difficult to track and trace events across all systems. Log aggregation solutions provides a series of benefits to distributed systems.
The problems it tackles are:
- Centralized, aggregated view over all log events
- Normalization of log schema
- Automated processing of log messages
- Support for a great number of event sources and outputs
One of the most prolific open source solutions on the market is the ELK stack created by Elastic.

ELK stands for Elasticsearch – Logstash – Kibana and they are respectively their Search engine, Log Shipper and Visualization frontend solutions. Elasticsearch becomes the nexus for gathering and storing the log data and it is not exclusive to Logstash.
Another very good data collection solution on the market is Fluentd, and it also supports Elasticsearch (amongst others) as the destination for it’s gathered data. So using the same data repository and frontend solutions, this becomes the EFK stack and if you do a bit of searching you will discover many people have chosen to substitute Elastic’s logstash with FluentD and we will talk about why that is in a minute.

Logstash vs FluentD
Both of them are very capable, have hundreds and hundreds of plugins available and are being maintained actively by corporation backed support.
Technology - Fluentd wins
The big elephant in the room is that Logstash is written in JRuby and FluentD is written in Ruby with performance sensitive parts in C. As a result the overhead of running a JVM for the log shipper translates in large memory consumption, especially when you compare it to the footprint of Fluentd. The only advantage that Logstash can still invoke is the good parallelism support that the JVM brings and very good Grok support.
The only downside for Fluentd was the lack of support for Windows, but even that has been solved and grok support is also available for Fluentd and you can even re-use the grok libraries you had used/built, even Logstash grok patterns.
Shippers - Fluentd wins
They both however offer the option of deploying lightweight components that will only read and send the log messages to a fully fledged instance that will do the necessary processing. These are called log forwarders and both have lightweight forwarders written in Go. As of this writing Elastic has released a replacement for it’s logstash-forwarder(formerly called Lumberjack) and it is built on top of it’s new Data shipper platform Beats, and it is called Filebeat.
This new Logstash forwarder allows for a TLS secured communication with the log shipper, something that the old one was not capable of but it is still lacking a very valuable feature that fluentd offers, and that is buffering.
Resiliency - Fluentd wins
As mentioned previously fluentd offers buffering, something that you get “for free” and coupled with the active client-side load balancing you get a very competent solution without a large footprint.
On the other side, logstash doesn’t have buffering and only has an in-memory queue of messages that is fixed in length (20 messages) so in case messages can’t get through, they are lost. To alleviate this weakness the common practice is to set up an external queue (like Redis) for persistence of the messages in case something goes wrong at either end. They are working on it though, so in the future we might see an improvement in this area.
Fluentd offers in-memory or file based buffering coupled with active-active and active-standby load balancing and even weighted load balancing and last but not least it also offers at-most-once and at-least-once semantics.
Additional considerations
Logstash benefits from a more chiselled, mature implementation due to the fact that the core and a lot of the essential plugins are maintained by Elastic, and some may argue that it’s easier to deploy a JRE and the logstash jar and be done with it while others would consider it overkill to have a JVM running for such a small task. Plus the need to deploy and maintain a separate queueing
Fluentd provides just the core and a couple of input/output plugins and filters and the rest of the large number of plugins available are community driven and so you are exposed to the risk of potential version incompatibilities and lack of documentation and support.
I have personally seen that there is a bit of chaos since each plugin creator will define his own set of configuration input variables and there isn’t a sense of consistency when you look at different plugins. You will encounter variables that are optional and have different default values, variables that are not properly documented but you can deduct their usage from the examples that the author offers and virtually all known naming conventions will appear in your config file.
What next?
Well, as you can probably already tell, I have chosen to go with fluentd, and as such it became quickly apparent that I need to integrate it with Elasticsearch and Kibana to have a complete solution, and that wasn’t a smooth ride due to 2 issues:
- Timestamps were sent to Elasticsearch without milliseconds
- All field values were by default analyzed fields
For communicating with Elasticsearch I used the plugin fluent-plugin-elasticsearch as presented in one of their very helpful use case tutorials.
This plugin allows fluentd to impersonate logstash by just enabling the setting logstash-format in the configuration file. I snooped arround a bit and found that basically the only difference is that the plugin will make sure that the message sent has a timestamp field named @timestamp.
And here we arrive at our first problem….
Timestamp fix
This is a pain because if you want to properly visualize a set of log messages gathered from multiple systems, in sequence, to be able to see exactly what step followed the other…..well, you see the problem.
Let’s take a look at what fluentd sends to Elasticsearch. Here is a sample log file with 2 log messages:
2015-11-12 06:34:01,471 [ ajp-apr-127.0.0.1-8009-exec-3] LogInterceptor                 INFO  ==== Request ===
2015-11-12 06:34:01,473 [ ajp-apr-127.0.0.1-8009-exec-3] LogInterceptor                 INFO  GET /monitor/broker/ HTTP/1.1
A message sent to Elasticsearch from fluentd would contain these values:
-this isn’t the exact message, this is the result of the stdout output plugin-
2015-11-12 06:34:01 -0800 tag.common: {"message":"[ ajp-apr-127.0.0.1-8009-exec-3] LogInterceptor                 INFO  ==== Request ===","time_as_string":"2015-11-12 06:34:01 -0800"}

2015-11-12 06:34:01 -0800 tag.common: {"message":"[ ajp-apr-127.0.0.1-8009-exec-3] LogInterceptor                 INFO  GET /monitor/broker/ HTTP/1.1\n","time_as_string":"2015-11-12 06:34:01 -0800"}
I added the time_as_string field in there just so you can see the literal string that is sent as the time value.
This is a known issue and initially it was the fault of fluentd for not supporting that level of granularity, but is had been fixed. Sadly, the fix has not made it’s way to the Elasticsearch plugin and so, alternatives have appeared.
The fix basically involves manually formatting the @timestamp field to have the format YYYY-MM-ddThh:mm:ss.SSSZ. So you can either bring on the previously mentioned fluent-plugin-better-timestamp into your log processing pipeline to act as a filter that fixes your timestamps OR you can build it yourself.
In order to build it yourself you only need the record_transformer filter that is part of the core of plugins that fluentd comes with and that I anyway would recommend you use for enriching your messages with things like the source hostname for example.
Next you need to parse the timestamp of your logs into separate date, time and millisecond components (which is basically what the better-timestamp plugin asks you to do, to some extent), and then to create a filter that would match all the messages you will send to Elasticsearch and to create the @timestamp value by appending the 3 components. This makes use of the fact that fluentd also allows you to run ruby code within your record_transformer filters to accommodate for more special log manipulation tasks.
<filter tag.**>
	type record_transformer
	enable_ruby true
	<record>
		@timestamp ${date_string + "T" + time_string + "." + msec + "Z"}
	</record>
</filter>
The result is that the above sample will come out like this:
2015-12-12 05:26:15 -0800 akai.common: {"date_string":"2015-11-12","time_string":"06:34:01","msec":"471","message":"[ ajp-apr-127.0.0.1-8009-exec-3] LogInterceptor                 INFO  ==== Request ===","@timestamp":"2015-11-12T06:34:01.471Z"}
2015-12-12 05:26:15 -0800 akai.common: {"date_string":"2015-11-12","time_string":"06:34:01","msec":"473","message":"[ ajp-apr-127.0.0.1-8009-exec-3] LogInterceptor                 INFO  GET /monitor/broker/ HTTP/1.1\n","@timestamp":"2015-11-12T06:34:01.473Z"}
Note: you can use the same record_transformer filter to remove the 3 separate time components after creating the @timestamp field via the remove_keys option.
Do not analyse
There are 2 reasons why you shouldn’t want your fields to be analyzed in this scenario:
- It will potentially increase the storage requirements
- It will make it impossible to do proper analysis and visualization on your data if you have field values that contain hyphens, dots or others.
Ok, so first, why does it increase the storage requirements?
Well, while researching what would be the proper hardware sizing requirements for setting up our production EFK installation I stumbled upon this post that goes in detail about what and why and how big can the problem become.
Worst case scenario, you could be using up to 40% more disk space than you really need. Pretty bad huh?
And the second issue which would become apparent much quicker than the first is that when you will try to make use of Kibana to visualize your data you will encounter the issue that fields that contain hyphens for example will appear split and duplicate when used in visualizations.
For instance, by using the record_transformer I would send the hostname and also a statically specified field called sourceProject, to be able to group together messages that came from different identical instances of a project application.
Using this example configuration I tried to create a pie chart showing the number of messages per project for a dashboard. Here is what I got.
<filter tag.**>
	type record_transformer
	enable_ruby true
	<record>
		@timestamp ${date_string + "T" + time_string + "." + msec + "Z"}
		sourceProject Test-Analyzed-Field
	</record>
</filter>
Sample output from stdout:
2015-12-12 06:01:35 -0800 clear: {"date_string":"2015-10-15","time_string":"06:37:32","msec":"415","message":"[amelJettyClient(0xdc64419)-706] jetty:test/test INFO totallyAnonymousContent: http://whyAreYouReadingThis?:)/history/3374425?limit=1","@timestamp":"2015-10-15T06:37:32.415Z","sourceProject":"Test-Analyzed-Field"}
And here is the result of trying to use it in a visualization:
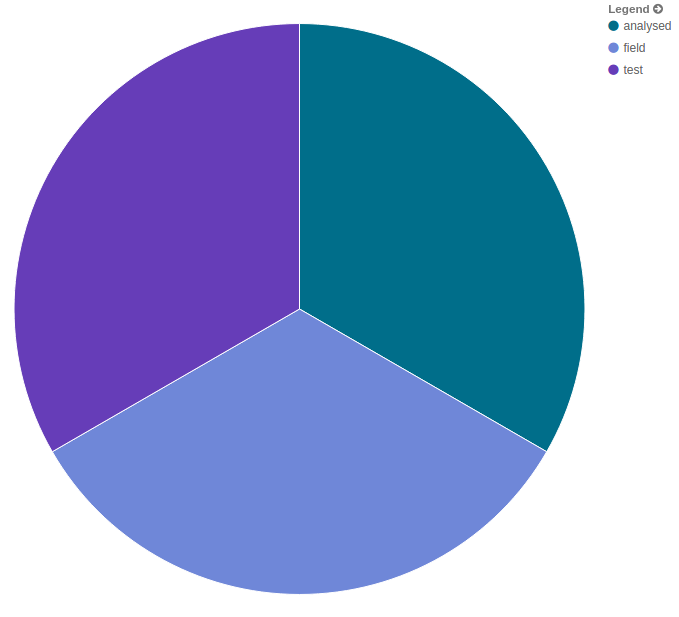
I should mention, what you are seeing is the result of 6 messages that all have the field sourceProject set to the value “Test-Analyzed-Field”.
Sadly, once you put some data into Elasticsearch, indices are automatically created (by the fluent-plugin-elasticsearch) and mappings along with them and once a field is mapped as being analyzed it cannot be changed.
Curiously this did not happen when using Logstash, which made me look into how they are handling this problem. Then I discovered the issue was discussed also in the context of the fluent-plugin-elasticsearch and the solution was posted there along with the request to include it in future versions of the plugin.
And the solution is: When Elasticsearch creates a new index, it will rely on the existence of a template to create that index. Logstash comes with a template of its own that it uses to tell Elasticsearch to create not analyzed copies of the fields it sends to it so that users can benefit from the analyzed fields for searching and the not analyzed fields when doing visualizations. And that template can be found here.
And what you basically need to do is to do a curl put with that json content to ES and then all the indices created that are prefixed with logstash-* will use that template. Be aware that with the fluent-plugin-elasticsearch you can specify your own index prefix so make sure to adjust the template to match your prefix:
curl -XPUT localhost:9200/_template/template_doru -d '{
  "template" : "logstash-*",
  "settings" : {....
}'
The main thing to note in the whole template is this section:
"string_fields" : {
  "match" : "*",
  "match_mapping_type" : "string",
  "mapping" : {
    "type" : "string", "index" : "analyzed", "omit_norms" : true,
    "fielddata" : { "format" : "disabled" },
    "fields" : {
      "raw" : {"type": "string", "index" : "not_analyzed", "doc_values" : true, "ignore_above" : 256}
    }
  }
}
This tells Elasticsearch that for any field of type string that it receives it should create a mapping of type string that is analyzed + another field that adds a .raw suffix that will not be analyzed.
The not_analyzed suffixed field is the one you can safely use in visualizations, but do keep in mind that this creates the scenario mentioned before where you can have up to 40% inflation in storage requirements because you will have both analyzed and not_analyzed fields in store.
Have fun
So, now you know what we went through here at HaufeDev and what problems we faced and how we can overcome them.
If you want to give it a try you can take a look at our docker templates on github, there you will find a logaggregation template for an EFK setup + a shipper that can transfer messages securely to the EFK solution and you can have it up and running in a matter of minutes.